SEO Business KPI Dashboard
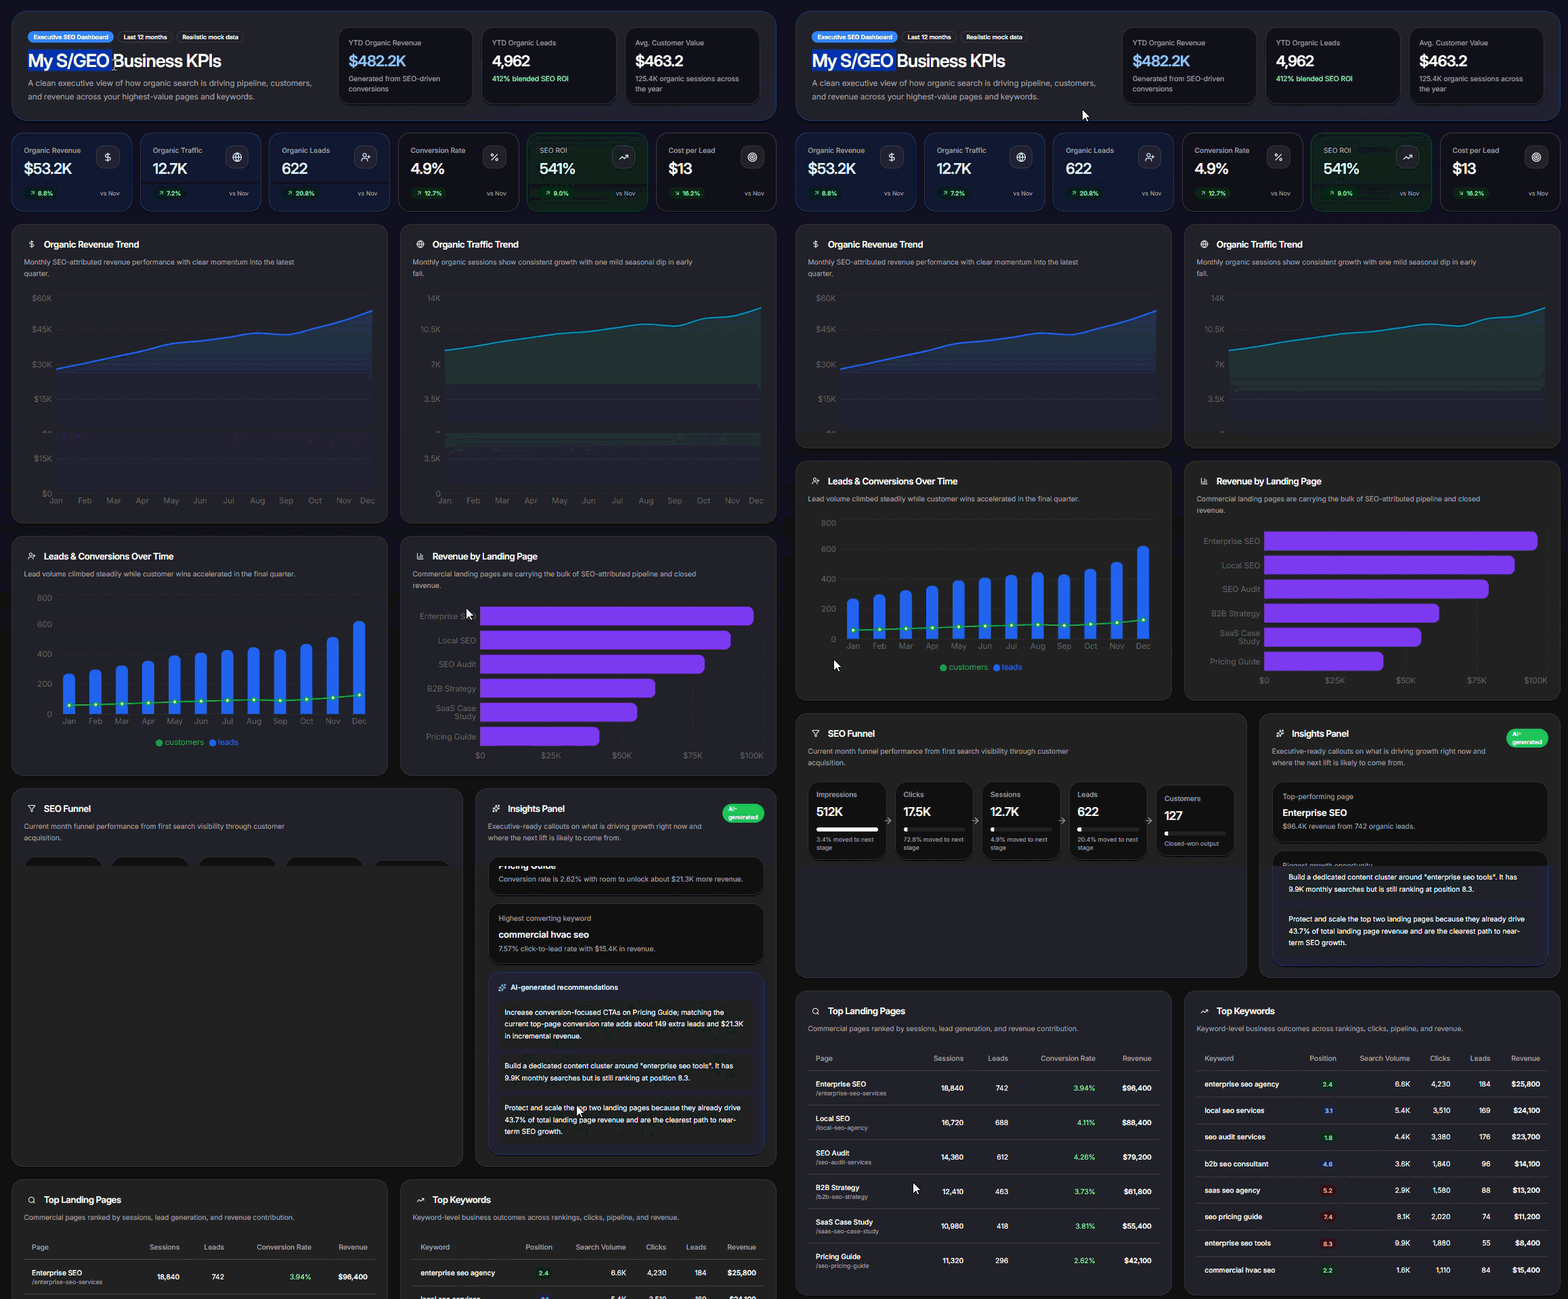
A professionally designed business KPI dashboard featuring a structured card-based layout that transforms complex performance data into clear, actionable insights. This dashboard design showcases effective data storytelling through intuitive charts, performance tracking, and actionable marketing analytics.
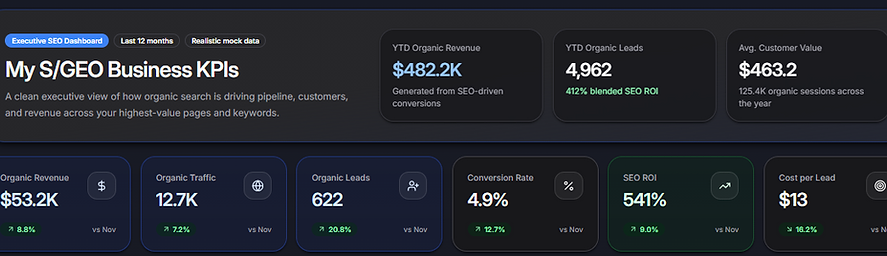
The dashboard includes a "Business KPIs" header section/card with key metrics such as year-to-date organic revenue, year-to-date organic leads, and average customer value. Additional KPI cards highlight organic revenue, organic leads, and conversion rate, demonstrating an effective approach to visualizing business growth, marketing performance, and customer acquisition data through intuitive dashboard design.

A visually engaging analytics section featuring two adjacent data visualization panels designed to communicate business performance trends clearly. The first panel (leftward) displays an Organic Revenue Trends graph that tracks revenue performance by month, helping identify growth patterns and seasonal changes. The second panel (rightward) presents an Organic Traffic Trend graph showing organic sessions over time, providing insights into website visibility and audience growth.

Two adjacent data visualization panels designed to highlight lead generation and revenue insights. The left card uses a vertical bar graph to display leads and conversion trends over time, helping identify changes in acquisition performance and customer engagement. The right card features horizontal bar graphs showing revenue by commercial landing page, providing a clear view of which pages contribute most to business growth.

A comprehensive SEO funnel performance panel with metric-displaying cards representing each stage of the SEO funnel. Each card highlights key monthly performance indicators for its corresponding funnel layer, helping users understand how organic search efforts contribute throughout the customer journey. The structured card layout makes complex SEO data easier to analyze by organizing metrics across visibility, traffic, engagement, and conversion stages.

An AI-powered insights panel designed to enhance dashboard intelligence by integrating specialized AI agents with different areas of expertise. The interface supports capabilities ranging from advanced data analysis and performance interpretation to generating clear narratives and business stories for non-technical audiences. By combining analytics with AI-driven explanations, this dashboard feature helps users move beyond raw metrics and understand the meaning, context, and actions behind their data. This design showcases an innovative approach to AI-assisted reporting, accessible insights, and human-centered data storytelling.